8. Randomness and Disorder
[status: content-mostly-written]
Purpose: to drive home the notion of disorder (and order) and how that relates to the probabilities of various situations.
Prerequisites:
- The basic Python course.
- Familiarity with simple plotting.
8.1. Experiment: burn a match
NOTE: this experiment should be carried out under adult supervision.
- Have a flat piece of metal, or a tile, or a very flat rock. Lay it down in a stable place.
- Light a match and before the flame reaches your finger, lay it gently on the flat metal or tile or rock.
- Watch it until it finishes burning and let it cool down.
- If possible, take the dark stick that is left and remake it into the original match.
8.2. Experiment: ink in water
- Find an ink-like substance.
- Fill a discardable plastic cup with water.
- Drop a single drop of the ink into the water.
- Observe the ink in the water the instant it falls in.
- Observe the ink in the water after thirty seconds.
- If possible, make the water return the drop of ink to where it was the instant it fell in.
8.3. Discussion on “ink in water” experiment
Discuss the meaning of the “ink in water” experiment with your partners. In particular discuss the meaning of the last step and whether it was possible.
8.4. Flipping a single coin
Take a coin and flip it 16 times. Tabulate the results like this:
H T T H H H T H T T H H T H T H ...
and so forth. Count how many times you get heads and how many times you get tails.
If you use 1 for heads and 0 for tails, calculate the average of all the tosses. In the few flips shown above it will be 0.5625: just a bit more than half of the tosses were heads.
8.5. Review: random numbers in Pythyon
To review random numbers, open the python interpreter with
$ python3
>>> import random
>>> random.random
## repeat that many times
>>> random.randint(-3, 12)
>>> random.randint(-3, 12)
## repeat that many times
>>> random.randint(0, 1)
## repeat that many times
8.6. Experiment: flipping a single virtual coin
8.6.1. Just the flips
Flipping coins just a few times can give inconsistent results. Let us explore how long it takes for the average number of heads and tails to become consistent.
In this experiment we will write a computer program to flip a single virtual coin and look at the results. Then we will update the program to keep track of the average between heads and tails. We will count heads as 1, tails as 0, and print the average as we keep flipping.
#! /usr/bin/env python3
import random

def main():
    n_runs = 16
    n_heads = 0
    n_tails = 0
    for i in range(n_runs):
        this_flip = random.randint(0, 1)
        if this_flip == 0:
            n_tails += 1
        else:
            n_heads += 1
        average = float(n_heads)/(n_heads + n_tails)
        print('%d    %f' % (i, average))

main()
Run this program with:
$ python3 single_coin_average.py
[... there will be output here ...]
$ python3 single_coin_average.py > coin_avg.out
Then plot the results with:
$ gnuplot
gnuplot> plot 'coin_avg.out' using 1:2 with linespoints
gnuplot> plot [] [0:1] 'coin_avg.out' using 1:2 with linespoints
Then change n_runs to be 100 and re-run the program and re-plot the results. Then plot 1000 runs.
8.6.2. Long-running average of single coin flips
Write the following program in the file single_coin_flip.py:
#! /usr/bin/env python3
import random

def main():
    n_runs = 16
    n_heads = 0
    n_tails = 0
    for i in range(n_runs):
        this_flip = random.randint(0, 1)
        print('%d    %d' % (i, this_flip))

main()
Run it with with:
$ python3 single_coin_flip.py
[... there will be output here ...]
$ python3 single_coin_average.py > coin_avg.out
Then plot the results with:
$ gnuplot
gnuplot> plot 'coin_flip.out' using 1:2 with linespoints pt 7 ps 1
Then change n_runs to be 100 and re-run the program and re-plot the results. Then plot 1000 runs.
8.7. Flipping multiple coins
Take two different coins and flip them 16 times. Tabulate the results like this:
H T
T H
T T
H H
...
and so forth. Count how many times you get all heads and how many times you get all tails.
Do the same thing with three coins.
8.8. Experiment: flipping virtual coins
Since the purpose of computers is to automate repetitive tasks, we should not go beyond flipping three coins. Rather, we will write a computer program to do so. Enter the following program as “many_coins.py”:
#! /usr/bin/env python3
import random

def main():
    n_runs = 16
    n_coins = 1

    n_heads = 0
    n_tails = 0
    n_all_heads = 0
    n_all_tails = 0
    for i in range(n_runs):
        this_flip = [0] * n_coins
        for coin in range(n_coins):
            flip = random.randint(0, 1)
            this_flip[coin] = flip
            if flip == 0:
                n_heads = n_heads + 1
            else:
                n_tails = n_tails + 1
            print('%s ' % ('H' if flip == 1 else 'T'), end="")
        if this_flip.count(0) == n_coins:
            n_all_tails = n_all_tails + 1
        if this_flip.count(1) == n_coins:
            n_all_heads = n_all_heads + 1
        print('')
    print('after %d flips of %d coins, we got the following:'
          % (n_runs, n_coins))
    print('HEADS: %d' % n_heads)
    print('TAILS: %d' % n_tails)
    print('TOTAL: %d' % (n_heads + n_tails))
    print('RUNS_WITH_ALL_HEADS: %d' % n_all_heads)
    print('RUNS_WITH_ALL_TAILS: %d' % n_all_tails)
    print('fraction_runs_all_heads: %f' % (float(n_all_heads)/n_runs))
    print('fraction_runs_all_tails: %f' % (float(n_all_tails)/n_runs))


main()
The variables at the top, n_runs and n_coins, set how many
runs you do and how many coins you flip in each run.
Experiment with n_coins = 2 and try to let n_runs go through
16, 50, and then try 1000. Run the program several times with each
value of n_runs and pay close attention to the output lines
fraction_all_heads and fraction_all_tails – are they more
consistent when n_runs is larger?
Do the same with n_coins set to 3, 4, 5, and then to 20, keeping
n_runs at 1000.
Discuss what you see happen to fraction_all_heads and
fraction_all_tails.
8.9. Experiment: back to physical coins - disorder
- Take 10 coins, set them up to be all heads and near each other on the ground.
- Take a spatula, slide it under the 10 coins, toss them high up in the air.
- Watch the debris and count heads and tails.
- Take the spatula again and use a single movement of the spatula to put all the 10 coins back into their original state (all near each other and all heads). If you cannot do this with a single movement of the spatula, give yourself 10 spatula moves.
- Repeat this experiment with the 10 coins stacked up instead “near each other”.
- Now do what you have to do to restore the 10 coins to the pile where they are all “heads up” using the spatula. I that fails, do so with your fingers.
8.10. The drunk fencer
Let us now start talking about random walks. I want to move toward discussing random walks in 2 dimensions, but it is easier to program a one-dimensional random lurching back and forth - the way a drunk fencer might move back and forth randomly rather than according to the needs of the bout.
Let us type in the program in Listing 8.10.1:
#! /usr/bin/env python3

import random
import math
import sys

def main():
    x = 0
    n_steps = 10
    if len(sys.argv) == 2:
        n_steps = int(sys.argv[1])
    take_walk(x, n_steps)

def take_walk(x, n_steps):
    for i in range(n_steps):
        ## generate a step of -1 or +1 in the x direction
        step_x = random.randint(0, 1) * 2 - 1
        x = x + step_x
        print(i, x, math.sqrt(i), math.fabs(math.fabs(x) - math.sqrt(i)))

main()
and run it and plot the results like this:
$ python3 walk-1d.py
$ python3 walk-1d.py > walk-1d.out
$ gnuplot
gnuplot> set grid
gnuplot> set size square
gnuplot> plot 'walk-1d.out' using 1:2 with lines
By changing the number of steps to 100, 1000 and 10000 you should see the plots in Figure 8.10.1.

Figure 8.10.1 The path of a drunken fencer 100, 1000, 10000 and 100000 steps.
8.11. The drunkard’s walk
Now we move on to the more gratifying 2-dimensional random walk, also called the drunkard’s walk.
First introduce the notion with pictures and possibly an acting out of drunk behavior. Then type in the program in Listing 8.11.1:
#! /usr/bin/env python3

import random
import math
import sys

def main():
    x = 0
    y = 0
    n_steps = 10
    if len(sys.argv) == 2:
        n_steps = int(sys.argv[1])
    take_walk(x, y, n_steps)

def take_walk(x, y, n_steps):
    for i in range(n_steps):
        ## generate steps of -1 or +1 in x and y directions
        step_x = 0
        step_y = 0
        ## use a coin toss to decide if we go in the x or y direction
        if random.randint(0, 1) == 0:
            step_x = random.randint(0, 1) * 2 - 1
        else:
            step_y = random.randint(0, 1) * 2 - 1
        x = x + step_x
        y = y + step_y
        distance = math.sqrt(x*x + y*y) # distance from the origin
        print(i, x, y, distance)
        ## NOTE: if you want you can go farther and explore the way
        ## average distance scales with the number of steps (should be
        ## proprtional to the square root of the number of steps).
        ## for this it might be interesting to also print math.sqrt(i)

main()
Examples of running this program:
$ python3 walk.py
$ python3 walk.py 20
$ python3 walk.py 100
Now we want to do a big run and save the data to a file:
$ python3 walk.py 1000000 > walk-1000000.out
Now we plot it. Note the tricks with the tail command which let
you plot just the first few lines rather than the whole file:
$ gnuplot
gnuplot> set grid
gnuplot> set size square
gnuplot> plot '<tail -100 walk-1000000.out' using 2:3 with lines
gnuplot> plot '<tail -1000 walk-1000000.out' using 2:3 with lines
gnuplot> plot '<tail -10000 walk-1000000.out' using 2:3 with lines
gnuplot> plot '<tail -100000 walk-1000000.out' using 2:3 with lines
gnuplot> plot '<tail -1000000 walk-1000000.out' using 2:3 with lines
By changing the number of steps to 100, 1000 and 10000 you should see the plots in Figure 8.11.1
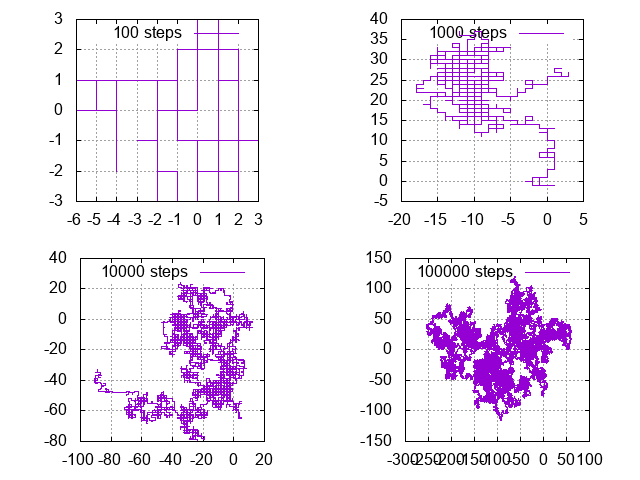
Figure 8.11.1 The path walked by a drunkard for 100, 1000, 10000 and 100000 steps. Note that for long walks the figure starts looking like a fractal.
8.12. Making a movie animation of the walk
A discussion of graphical file formats: mention png (portable network graphics), jpeg (joint picture expert group), and mpeg (motion picture expert group).
We will use gnuplot to generate a sequence of images in png format,
then use either ffmpeg or convert or mencoder to convert
the sequence of frames into a movie.
gnuplot usually draws its output to the screen, but we can change that
behavior and have it generate a .png file. To do so we add a
couple of lines at the top:
$ gnuplot
gnuplot> set grid
gnuplot> set size square
gnuplot> set terminal png
gnuplot> set output 'walk-100.png'
gnuplot> plot '<tail -100 walk-1000000.out' using 2:3 with lines
gnuplot> set terminal png
gnuplot> set output 'walk-1000.png'
gnuplot> plot '<tail -1000 walk-1000000.out' using 2:3 with lines
gnuplot> quit
$ ls
After running this last example you should find that there are a
couple of new files in this directory: walk-100.png and
walk-1000.png. If you view them with your favorite image viewer
(you might want to consider the viewer geeqie) you will see that
they are indeed the plots you wanted to make.
Our first task is to automate this process to generate hundreds or
thousands of individual static images. The program walk-movie.py
in Listing 8.12.1 does so.
#! /usr/bin/env python3

"""Makes a movie from a random walk output file."""

import os
import sys


def main():
    n_frames = 500
    n_steps = 1000000
    walk_file = 'walk-%d.out' % n_steps
    if len(sys.argv) == 3:
        walk_file = sys.argv[1]
        n_frames = int(sys.argv[2])
        n_steps = int(os.popen("wc %s | awk '{print $1}'" % walk_file).read())
    print('Using %d frames from input file %s which has %d steps'
          % (n_frames, walk_file, n_steps))

    if not os.path.exists(walk_file):
        print('error: you must prepare the file %s -- you can do this with:'
              % walk_file)
        print('    ./walk.py %d > %s' % (n_steps, walk_file))
        sys.exit(1)

    gp_fname = 'walk_step.gp'
    for frame in range(0, n_frames):
        this_step = int(frame*n_steps/n_frames) # go in jumps
        this_step = max(this_step, 10)           # avoid small numbers
        png_fname = 'walk_frame-%06d.png' % frame
        if os.path.exists(png_fname):
            sys.stdout.write('## no need to rebuild %s        \r' % png_fname)
            sys.stdout.flush()
            continue
        gp = """set grid
set size square
set terminal png
set output '%s'
plot '<head -%d %s' using 2:3 with lines
quit\n""" % (png_fname, this_step, walk_file)
        f = open(gp_fname, 'w')
        f.write(gp)
        f.close()
        os.system('gnuplot %s' % gp_fname)
        percent = 100.0*frame / n_frames
        if frame % 10 == 0:
            sys.stdout.write('Making individual frames -- %.02f%% completed          \r' % percent)
            sys.stdout.flush()
    print()
    print('## now you can make a movie with something like:')
    print('ffmpeg -framerate 24 -i walk_frame-%06d.png walk-movie.mp4')
    print('## or:')
    print('ffmpeg -framerate 24 -i walk_frame-%06d.png walk-movie.ogg')
    print('## or:')
    print('convert walk_frame*.png walk-movie.mp4')
    print('## or for a more powerful encoder:')
    print('mencoder "mf://walk_frame*.png" -o walk-movie.mp4 -ovc lavc')
    print('## or in reverse:')
    print('ls -1 -r walk_frame*.png > reverse_filelist')
    print('mencoder "mf://@reverse_filelist" -o walk-movie-reverse.mp4 -ovc lavc')

main()
If you run this program it will generate n_frames different frames
(the default in the program is 1000). To make a more satisfying movie
we should increase this, but let us start with 1000 to make the
program run more quickly.
walk-movie.py will pick out the random walk steps jumping 100 every
time (see the line that says n_steps = i*100). It then generates a
sequence of gnuplot commands like the one we saw above to generate
file names that look something like walk_frame-000023.png.
If we run the program and the list the directory:
$ python3 walk-movie.py
$ ls
we see that the program has generated a bunch of .png files
(initially 1000 of them). Your favorite graphic viewer might allow
you to press the space bar and almost see an animation of them.
Now let us talk about making a movie. There are several programs
which encode a sequence of static image files into an mpeg movie. I
mention three such programs: ffmpeg, convert and mencoder.
The walk-movie.py program gave us a tip on how to run those
programs to encode all the frames into the movie file
walk-movie.mp4:
$ ffmpeg -framerate 24 -i walk_frame-%06d.png walk-movie.mp4
or
$ convert walk_frame*.png walk-movie.mp4
or
$ mencoder "mf://walk_frame*.png" -o walk-movie.mp4 -ovc lavc
or, to make a movie in reverse:
$ ffmpeg -framerate 24 -start_number -999999 -i walk_frame-%06d.png walk-movie.mp4
## FIXME: the reverse order with a negative start number needs to
## be ironed out.  Maybe ffmpeg can take an `ls -r ...` on the
command line.
or
$ ls -1 -r walk_frame*.png > reverse_filelist
$ mencoder "mf://@reverse_filelist" -o walk-movie-reverse.mp4 -ovc lavc
Note that the simplest and fastest approach is to use ffmpeg (the
“Swiss army knife” of video and audio formats) so I will continue with
ffmpeg for my examples.
You can now play these movies with your favorite movie player - I
recommend vlc, though your system might come with totem already
installed:
$ vlc walk-movie.mp4
$ vlc walk-movie-reverse.mp4
I wrote walk-movie.py to only generate 500 frames so that it can
run quickly when I give examples or when I build this book, but you
should increase that number a lot so you can see a longer movie with
more detail.
Playing the movie shows you the growth of a fractal. It is interesting to watch how sometimes it adds paths in a clump, while sometimes it darts off into another sector of the plane, creating some filaments that connect the thicker bushes.
8.13. Discussion
Discuss the result of these experiments with your partners. Ask each other the following questions and write slides to present your answers. You might write one slide for each few related questions. You may include any of the plots you made in this course into your slides.
- Look at the first two plots we made. In the first one (single coin flips) note that a new point in the plot is completely independent of the previous ones. In the second one (running average of single coin flips) is each new point on the plot related to previous ones? Are there two types of random events - those that are fresh and new, and those that add a small random change to a previous state? The former is called a Poisson process, the latter is called a Markov process or a Markov chain.
- Look at the plot of averages from the single coin experiment and tell a story of what is going on in that plot, addressing the fact that initially it fluctuates quite a bit and later it seems to converge to 0.5.
- Is this related to how many more ways you can create 10 disordered coins than 10 ordered coins?
- Was it more work to restore the 10 coins to “heads up” or was it more work to toss them with the spatula.
- Why it easier to restore 10 coins to their initial “heads up” state than to restore the drop of ink to its inital state?
- Is it easier to go from order to disorder or from disorder to order?
- Have you heard of Entropy? If not, now you have. Entropy is related to the idea of disorder. One of the deepest laws in physics is the Second Law of Thermodynamics. One of the ways of stating the second law is that the entropy of the universe is always increasing.
- Referring back to the Emergent Behavior short course, remember how in that situation we examined systems that go from chaos to order: a random first row in a cellular automaton becomes a pattern of triangles, and a random initial state in John Conway’s game of life can produce ordered patterns as well as gliders. Discuss how emergent behavior seems to produce order out of chaos - does this violate the second law of thermodynamics?
- Discuss the cycle that brings to living creatures: trees, flowers, cats, dogs, horses, humans… Is each living creature more or less ordered than the molecules in the earth and air from which that creature is made?
8.14. Further reading and videos
A cartoon video for kids on entropy:
https://www.youtube.com/watch?v=Tay3-2WKQ5Y
Jeff Phillips’s TED-ed video “What is entropy?”:
https://www.youtube.com/watch?v=YM-uykVfq_E
The “What is Entropy?” video from “The Good Stuff”:
https://www.youtube.com/watch?v=gS_C7dM25pc
Science asylum video on entropy:
https://www.youtube.com/watch?v=ykUmibZHEZk
Try this:
https://www.youtube.com/watch?v=lj5tqM5GZnQ
starting at minute 14:10
Feynman’s lecture on “The Distinction of Past and Future”: